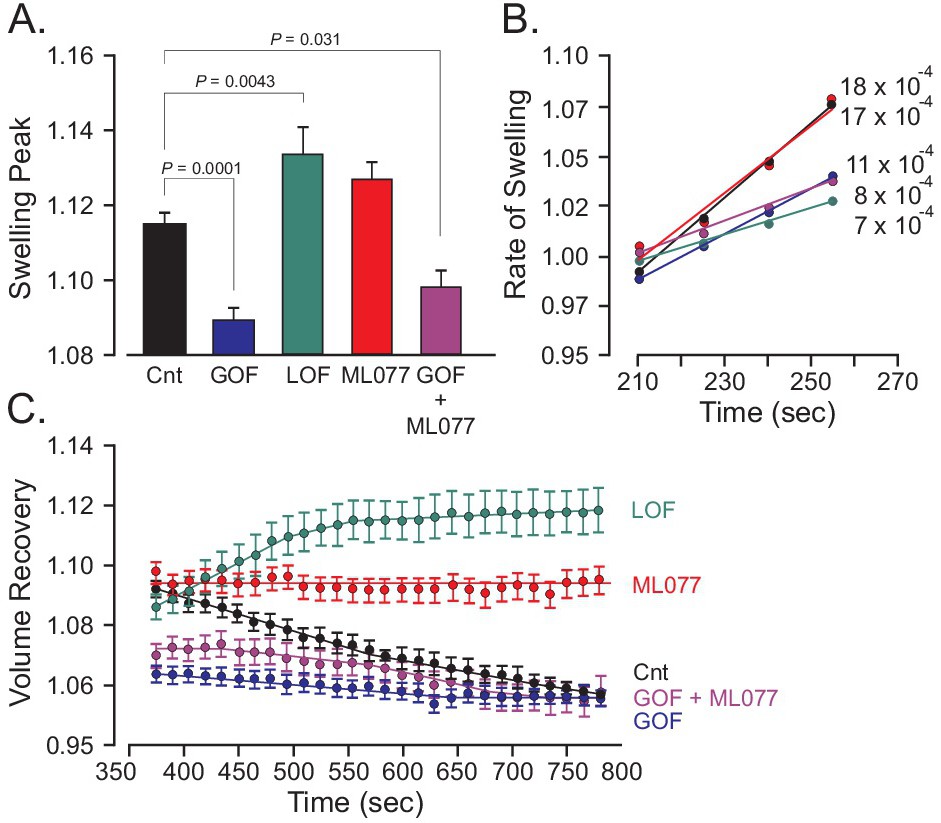
Fig. 5. Osmotic behavior broken-down by components. A, Extent of swelling of control neurons (black bar), KCC3 gain-of function (T991A) neurons (blue bar), KCC3 loss-of-function (knockout) neurons (green bar) and wild-type neurons exposed to 10 µM ML077 (red bar). Note the significant (One-way ANOVA) reduction in swelling elicited by the neurons expressing the constitutively active transporter and significantly increased swelling elicited by neurons lacking KCC3 expression. Treatment with ML077 showed no significant difference compared to control (P = 0.06). Bars represent means ± SEM (the number of neurons per genotype is listed in the legend of Fig. 4). B, Rate of swelling as calculated by the slope of volume increase. Control neurons: y = 0.0011 x + 0.7596; control neurons with ML077: y = 0.0010 x + 0.7984; neurons expressing KCC3 gain-of-function: y = 0.0007 x + 0.8448; and neurons lacking KCC3: y = 0.0006 x + 0.8178. C, Regulatory volume decrease phase as measured over a 10 min period with only untreated wild-type neurons showing a negative slope.